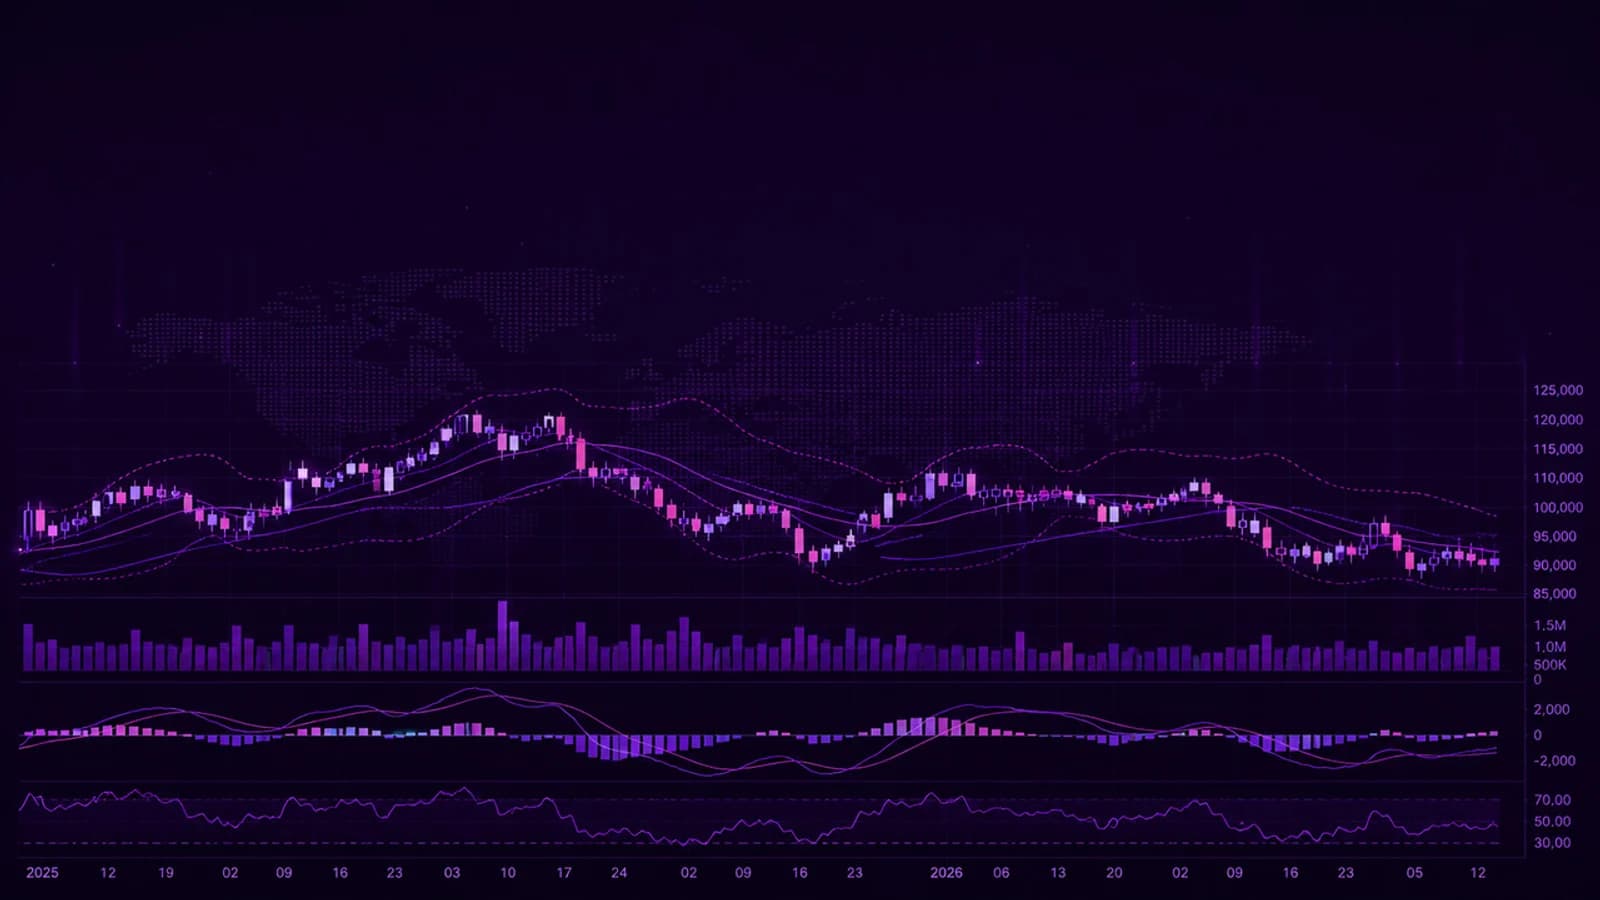
Crypto Fear & Greed Index Falls from 'Extreme Greed' to 'Neutral' in a Month…Derivatives Volume Surges 46% in a Day
While investor sentiment in the virtual asset market is rapidly cooling, trading in derivatives such as futures and options has increased significantly. This is interpreted as leveraged investors rebuilding positions in preparation for the next move while the spot market remains directionless. ■ Fe

While investor sentiment in the virtual asset market is rapidly cooling, trading in derivatives such as futures and options has increased significantly. This is interpreted as leveraged investors rebuilding positions in preparation for the next move while the spot market remains directionless.
■ Fear & Greed Index at 51, 'Neutral'…Down 28 Points in a Month
According to CoinMarketCap (CMC) on October 21, 2026, the CMC Fear & Greed Index stood at 51, remaining in the 'Neutral' zone. This was the same as the previous day and 1 point higher than a week ago. A month ago, the index was at 79, in the 'Extreme Greed' stage. The index has dropped 28 points over the month, largely unwinding the overheated market sentiment.
A state of neither fear nor greed is regarded as an environment where price formation driven by emotions can be expected to be less likely. However, it also means there is no clear catalyst to pull the market in one direction.
■ Market Cap at $2.77 Trillion…One-Day Rebound, Weekly Trend Still Weak
The total virtual asset market capitalization stood at $2.77 trillion, up 1.56% from 24 hours earlier. This implies the previous day's market cap was around $2.727 trillion, meaning roughly $43 billion flowed in over a single day. On a 7-day basis, however, it fell 0.87%, with the market cap a week ago estimated at about $2.794 trillion. While a short-term rebound occurred, it is not yet enough to reverse the weekly downtrend.
■ Derivatives Volume Surges 46.13% in a Day…Open Interest Up Only 1.87%
The notable point is the derivatives market. 24-hour derivatives trading volume reached $777.24 billion, up 46.13% from the previous day. The prior day's volume is estimated at about $531.9 billion, meaning roughly $245 billion in additional volume in one day. Derivatives volume equals about 28% of the total market capitalization.
However, the open interest (OI) growth rate was only 1.87%. This means trading surged but few new positions were built. The volume may have been driven by the replacement of existing positions or short-term trading rather than new entries.
The average funding rate remained positive at 0.006%. Under this structure, holders of long (buy) positions pay fees to the short (sell) side, showing that leveraged demand betting on a rise still remains.
■ Social Sentiment Slightly Optimistic…"Bitcoin at $500,000" vs "Ethereum Crash Warning"
Social media sentiment tilted slightly toward optimism. CMC's net social sentiment score was 5.8 out of 10. Bitcoin (BTC), Ripple (XRP), and Ethereum (ETH), the most mentioned assets, all exceeded the neutral benchmark of 5, and both post counts and reactions showed bullish opinions far outweighing bearish ones.
However, views diverged even among influential accounts. An account with about 70,000 followers claimed Bitcoin would reach $500,000, arguing the largest rally in history has not yet begun. In contrast, an account with 2.2 million followers warned of a possible sharp decline, saying Ethereum's expected October rally had fallen through. Optimism prevails, but uncertainty underlies the market.
■ Three Checkpoints to Watch
① Whether the market cap support level holds — CMC identified $2.77 trillion, the 78.6% Fibonacci retracement level, as the key support line. The current market cap is essentially at this level, putting the support to the test.
② Volatility after the derivatives volume surge — Volume spikes often precede major price movements. It is necessary to also check whether open interest grows in earnest and whether funding rates soar into overheated territory.
③ The direction of the Fear & Greed Index — Whether the index moves back toward greed or tilts toward fear from the neutral zone will serve as a clue to gauge the recovery of spot demand.
[This article is for informational purposes only and does not recommend buying or selling any specific virtual asset. Virtual assets are highly volatile, so investment decisions and their responsibilities rest with the investor. AI assisted in part.]
CBC Globe publishes verified stories with editorial review, source checks, and tenant-specific publication standards.
Related Articles

Janction and Doodles Soar Over 100%, Convex Finance Rises 'Gradually' — Differences in Altcoin Money Flows

[Breaking] Bitcoin Price at $82,721... Breaking $83,000 Is the Key Turning Point; Drop to $79,700 Possible

[Breaking] Solana (SOL) at $106.19... Breakout Above Downtrend Line, $113 Upside Potential Draws Attention