Harmony (ONE) Soars 62%... Trading Volume Surges to 13.3 Billion Coins, Accompanied by MACD Golden Cross and RSI 86 Overbought Warning
Harmony (ONE) surged more than 60% in a single day, showing a strong uptrend in the virtual asset market. As trading volume expanded significantly, technical bullish signals followed one after another, including a MACD (Moving Average Convergence Divergence) golden cross and a SuperTrend shift to a
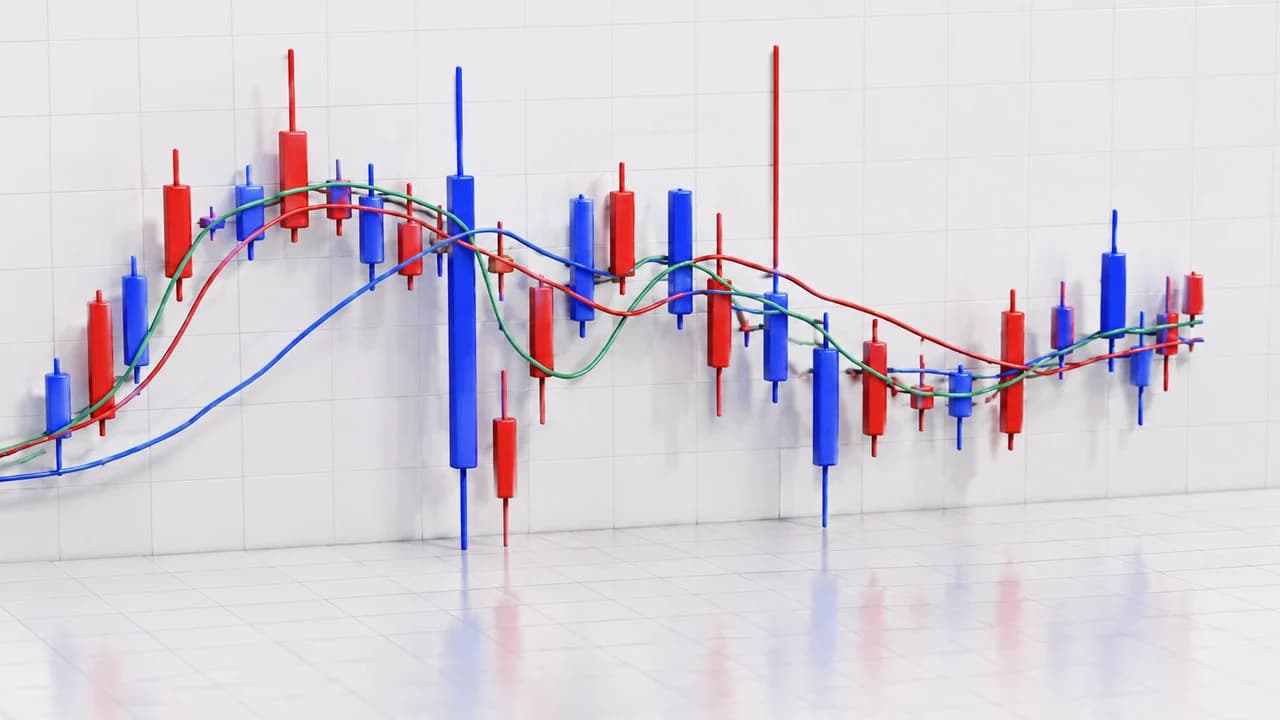
Harmony (ONE) surged more than 60% in a single day, showing a strong uptrend in the virtual asset market. As trading volume expanded significantly, technical bullish signals followed one after another, including a MACD (Moving Average Convergence Divergence) golden cross and a SuperTrend shift to a buy signal. However, with the short-term Relative Strength Index (RSI) exceeding 86 and net outflows observed in large-scale trades, attention is focused on whether the sharp rally can be sustained.
[Price Movement] On the 7th, Harmony recorded a price of $0.001932. This represents a 62.22% increase compared to the 24-hour opening price of $0.001191. The intraday low was recorded at $0.001173 and the high at $0.001985. The increase from the low to the high reached approximately 69.22%. Notably, the current price is relatively close to the intraday high—$0.001932 is about 2.67% below the peak. While the coin has retained a significant portion of its gains after the surge, the very large short-term price volatility makes it difficult to predict future movements.
[Trading Volume Surge] A notable aspect of this rally is the trading volume. Recent daily trading volume recorded approximately 5.16 billion ONE, 1.74 times the average trading volume of the past 7 days, and the previous day's volume reached approximately 13.38 billion ONE. The timing of the sharp volume increase coincided with the price rise, indicating expanded market participation. Trading volume growth is one of the key indicators for judging the sustainability of a price increase. In particular, when volume grows alongside a rapid price rise, it can be interpreted as active participation from both buyers and sellers. However, volume expansion itself does not confirm buyer dominance, as profit-taking sell orders from existing holders can emerge simultaneously during a sharp rally.
[Technical Signals] Short-term bullish signals were also observed in technical indicators. The MACD recorded a golden cross the previous day. A MACD golden cross generally refers to the MACD line crossing above the signal line, and is used to assess the potential strengthening of short-term upward momentum. The SuperTrend indicator is also pointing upward. In terms of returns, the 5-day return was 55.52% and the 7-day return was 62.52%. With the price increase, volume expansion, and technical indicator reversals appearing simultaneously, Harmony's short-term trend can be seen as forming strong momentum.
[Long-Term Trend and Background of the Rally] However, the long-term price trend tells a different story. Harmony's 1-year return was recorded at -60.04%. Despite this surge, it has not recovered from a substantial long-term decline. Therefore, rather than confirming the current rally as a long-term trend reversal, it should be viewed as a high-volatility rebound accompanied by increased trading volume in an asset that has declined over a long period. Notably, no single official project announcement or definitive business catalyst that could explain the surge has been identified. Based on the indicators currently available, the explanation of a short-term rebound combining price, volume, and technical signals is relatively well-founded.
[Overheating Warning] Signs of overheating have also appeared. As of the 6th, the RSI(6) recorded 86.37. Generally, an RSI above 70 is classified as overbought, and Harmony far exceeded this threshold. A high RSI alone does not mean an immediate price decline will occur—in strong uptrends, overbought conditions can persist for a considerable period. However, if buying momentum slows after a rapid price increase, volatility could expand. Net fund flow based on large trades was recorded at -2.33%. This indicator suggests the possibility of some seller dominance in large-scale trades during the surge. However, interpretations may vary depending on the calculation methodology and differences in exchange data, so it cannot be concluded as a definitive capital outflow from the overall market.
[Key Price Levels to Watch] An important level for future price movement is around the intraday high of $0.001985. It will be necessary to check whether trading volume is sustained as Harmony moves above that level. Conversely, if the price falls back with declining volume, profit-taking pressure from the short-term surge could increase. The intraday low of $0.001173 is also a reference level for judging potential volatility expansion. However, it cannot be definitively stated that these two price levels will act as confirmed support and resistance lines going forward.
Harmony's surge draws attention in that it combines volume expansion with technical bullish signals. At the same time, the simultaneous appearance of an overbought RSI and net outflow signals in large-scale trades shows that risk factors have grown alongside the pace of the rally. Ultimately, the key lies in whether volume and price can be maintained after the surge. Rather than the 60%-plus daily gain itself, how sustained the buying pressure is in subsequent trading is expected to be an important criterion for judging the short-term trend. Meanwhile, according to Reuters, a source for reading the global economy, it is also worth noting that the UK raised interest rates for the first time in three years.
[Some AI assistance was used in producing this article. This article does not recommend buying or selling any specific asset; investment decisions and responsibility rest with the investor.]
CBC Globe publishes verified stories with editorial review, source checks, and tenant-specific publication standards.
Related Articles

[Breaking] Bitcoin (BTC) Battles to Reclaim $76,000... Sustained Rebound Is Key Question

Ethereum (ETH) Rebounds to $2,245, but Concerns Persist... Nasdaq Plunge and Monetary Policy Uncertainty Put Trend Reversal to the Test

Pudgy Penguins (PENGU) Plunges 24% in a Month... Causes of the Downtrend and Key Factors Ahead